Legionella sample size reporting requirements
Dr Jennifer Newton, Express Micro Science
Laboratory test reports must comply with ISO 17025 requirements for reporting results. These requirements include having a unique identifier (the lab number), citing the receipt and test date, providing a unique description of the sample
submitted and in the case of water testing the date and time the sample was taken. All additional information about the sample’s state should also be reported, e.g. incorrect temperature, damaged container etc.
This is before we ever see a result. When reporting the result, it is important that a method reference is provided, and the units of the result is given. For an example, see Figure 1.
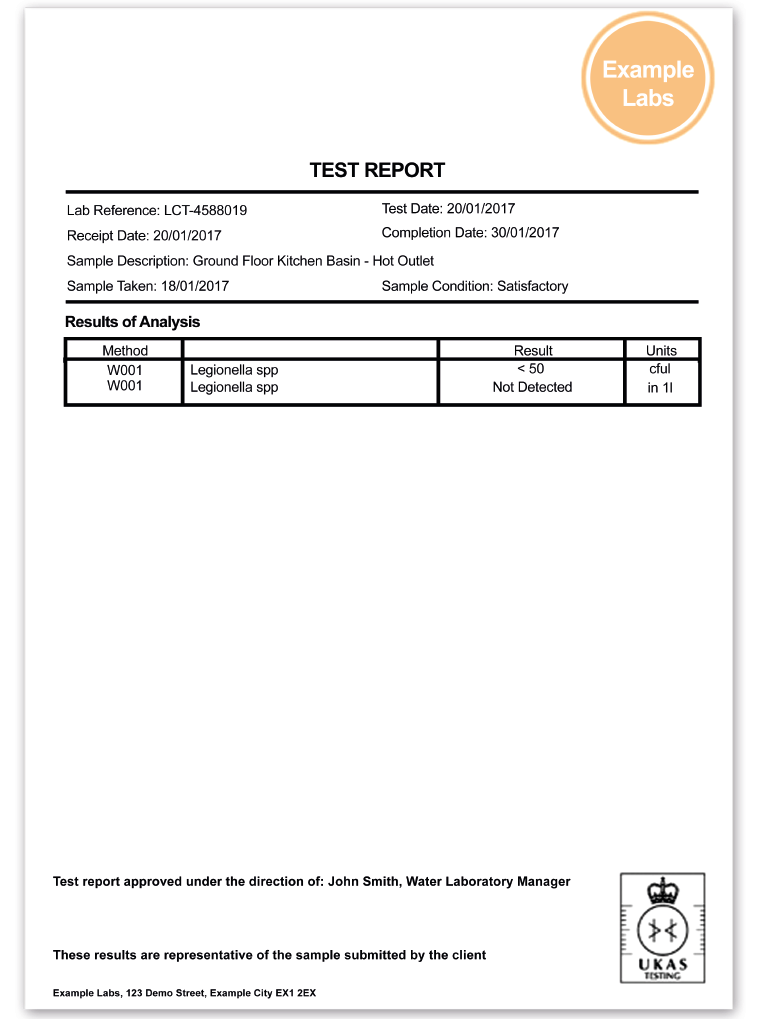
Figure 1.
This is an excellent example for reporting legionella, we know the lab number, when the lab received the sample, when they tested it, what the sample was, we also can surmise there was nothing unusual with the sample when it arrived at the lab and nothing untoward happened during the test which followed method W001 (this is the number which should match the reference on the lab’s UKAS scope of accreditation).
It also tells us the limit of detection for the test which is very useful for the end user to know as providing only the result “none found” in 1 litre does not tell us how many Legionella spp might be there but remain undetected due to the limits of the test.
It is also a requirement of the method most laboratories follow for legionella testing: ISO 11731: Water quality — Enumeration of Legionella, to report the volume of water tested. From this report we should be satisfied that a litre of sample was tested. It has happened in the past, that laboratories would sample a smaller volume than 1 litre and make a correction up to 1 litre and report that value. This is not allowed in the ISO method and is not accepted by UKAS as valid.
You may ask why this previous common practice is not acceptable? To answer this question an understanding of the uncertainty of the sampling and the method is necessary. To accurately assess the reliability of the information provided on microbiological test reports, there are two main factors to consider:
A. How uniformly are the bacteria distributed within the water source being tested?
B. How repeatable is the test method used by the laboratory?
Generally, in water microbiology, the first sample variability (factor A), the bacterial content at the water source, is the more important (1). This type of variability should be clear to all staff with an interest in the of
samples for analysis, the interpretation of results and any subsequent actions. (2)
The second source of uncertainty is the laboratory’s concern and when those laboratories are accredited – UKAS’s. And where laboratories test a smaller volume than that recommended by the international standards there is a marked
effect on the repeatability of the test method – reducing the reliability of the result by affecting factor B above.
When smaller volumes of sample are taken than the recommended 1 litre, a dilution factor is used to estimate how many bacteria would be in a litre of that same water. This is the same principle used when diluting samples which may be over-contaminated, e.g. where a sample of water has more than 300 E. coli in 100ml the laboratory will take a 10ml sample to obtain an accurate count from the membrane but then multiply the result by 10 to get an estimation of what the sample holds per 100ml. However, this practice increases the uncertainty of the method. The variability introduced by dilution is likely to be relatively small compared with the variability in bacterial density in a water source, where numbers are sufficiently high to require dilution of the sample before examination (2) but this is not the case where numbers are low (see table 1).
Table 1: Estimated count per 100 ml and 95 % confidence intervals for the number of E. coli reported in 100 ml of sample, where a sub-sample is examined, following dilution.
| Number of organisms found in subsample | 10 fold dilution | 100 fold dilution | ||
|---|---|---|---|---|
| Estimated Count | Range of Uncertainty | Estimated Count | Range of Uncertainty | |
| 10 | 100 | 50 – 180 | 1000 | 480 – 1830 |
| 50 | 500 | 380 – 650 | 5000 | 3750 – 6640 |
| 100 | 1000 | 820 – 1200 | 10000 | 8190 – 12200 |
The numbers presented in Table 1 are not directly relatable to counts for enumerating Legionella due to two main differences:
1. Legionella is supposed to be tested in 1 litre, and when it is not, it generally is not diluted 10 times (the equivalent volume being tested would be 100ml) and virtually never by 100 (the equivalent volume being tested would be 10ml). It is more common to test a ¼ or ½ the recommended volume, which will lead to less variance than the data presented in Table 2.
2. In the E. coli method used for the data in Table 1, each colony growing on the membrane equates to one of the bacterial count contained within the test water. This is not the case for legionella testing (unless direct membrane method is used, which is only practical for very clean waters). In the legionella method there is a further dilution in the preparation stage. This leads to each colony growing on the GVPC agar plate representing 20 to 100 bacteria in the original water, depending on the laboratory’s protocol. Thus, the variance will be much larger than those reported in the table above. An example would be:
Table 2: Estimated count per 1000 ml and 95% confidence intervals for the number of Legionella reported in 1 litre of sample, where a sub-sample is examined.
| Number of organisms found in subsample | 10 fold dilution (testing 100ml) | 100 fold dilution (testing 10ml) | ||
|---|---|---|---|---|
| Estimated Count in sample | Range of Uncertainty | Estimated Count in sample | Range of Uncertainty | |
| (method LOD 50) | 100 | 50 – 180 | 1000 | 480 – 1830 |
| 10 colonies on GVPC plate | 5000 | 2500 – 9,000 (a) | 50000 | 24,000 – 91,500 (a) |
(a) These are calculations based on Table 1 and not determined through analysis.
Compare the ranges in uncertainty from Table 2 and Table 3, which displays typical uncertainty values for a laboratory testing a litre sample of water for legionella. To provide the most reproducible result to the end user, it is clear the laboratory should offer 1 litre sized sample testing. Additionally, a result reported per 1 litre can be compared directly against criteria set out in the various HSG (Health and Safety Executive Safety Guidance Documents) and HTM (Department of Health – Health Technical Memorandums) documents on Legionella.
Table 3: Estimated count per 1000 ml and 95% confidence intervals for the number of Legionella reported in 1 litre of sample, where a litre of sample is examined
| Number of coloniesCounted on GVPC | No dilution(testing 1000ml) (b) | |
|---|---|---|
| (method LOD 50) | Estimated Count in sample | Range of Uncertainty |
| 1 | 50 | 35 – 72 |
| 10 | 500 | 350 – 720 |
| 100 | 5000 | 3500 – 7200 |
| 1000 | 50,000 | 34,690 – 72,080 |
(b)Typical level of uncertainty for a UKAS accredited lab testing Legionella.
Should your laboratory test a different volume than the recommended 1 litre, say 500 ml or less, the accredited result will be the result per sample size tested; for example, None Detected in 500ml or 100 cfu in 500ml. When judging these results against legislative guidelines, you must multiple the number on your Test Report by the appropriate dilution factor and be aware that the actual number of legionella in 1 litre of sample could be considerably more factoring in the additional variation explained above.
For monitoring purposes this estimated result may be fit for purpose, i.e. it is a good guide as to what corrective actions are most appropriate. That is for the end user to decide and not the laboratory. However, best practice is if you want a result in 1 litre, get 1 litre of water tested. If this is not possible you must make a calculation to compare your results with legislative guidelines. Should the result be challenged the estimated result will not be the valid one in a court of law and may require justification as to why it was used.
REFERENCES
Ref: 1. Potential inaccuracy of microbiological counts from routine water samples. Water Science and Technology, Tillett, H. E., 1993, 27, 15-18.
Ref 2: Methods for the Examination of Waters and Associated Materials: The Microbiology of Drinking Water (2002) – Part 3 Practices and procedures for laboratories, The Environment Agency (Standing Committee of Analyst)